BMI for men

BMI formula

The BMI (Body Mass Index) in (kg/m2) is equal to the mass in kilograms (kg) divided by the square height in meters (m):

BMI(kg/m2) = mass(kg) / height2(m)

The BMI (Body Mass Index) in (kg/m2) is equal to the mass in pounds (lbs) divided by the square height in inches (in) times 703:

BMI(kg/m2) = mass(lb) / height2(in) × 703

Categories

A common use of the BMI is to assess how far an individual's body weight departs from what is normal or desirable for a person's height. The weight excess or deficiency may, in part, be accounted for by body fat (adipose tissue) although other factors such as muscularity also affect BMI significantly (see discussion below and overweight).

The WHO regards a BMI of less than 18.5 as underweight and may indicate malnutrition, an eating disorder, or other health problems, while a BMI equal to or greater than 25 is considered overweight and above 30 is considered obese. These ranges of BMI values are valid only as statistical categories.

BMI Category BMI Range
(kg/m2)
Health risk
Underweight 18.4 and below Malnutrition risk
Normal weight 18.5 - 24.9 Low risk
Overweight 25 - 29.9 Enchanced risk
Moderately obese 30 - 34.9 Medium risk
Severely obese 35 - 39.9 High risk
Very severely obese 40 and above Very high risk

BMI Calculator

ft
in
lb
kg/m2


Body mass index (BMI) is a value derived from the mass (weight) and height of a person. The BMI is defined as the body mass divided by the square of the body height, and is universally expressed in units of kg/m2, resulting from mass in kilograms and height in metres.

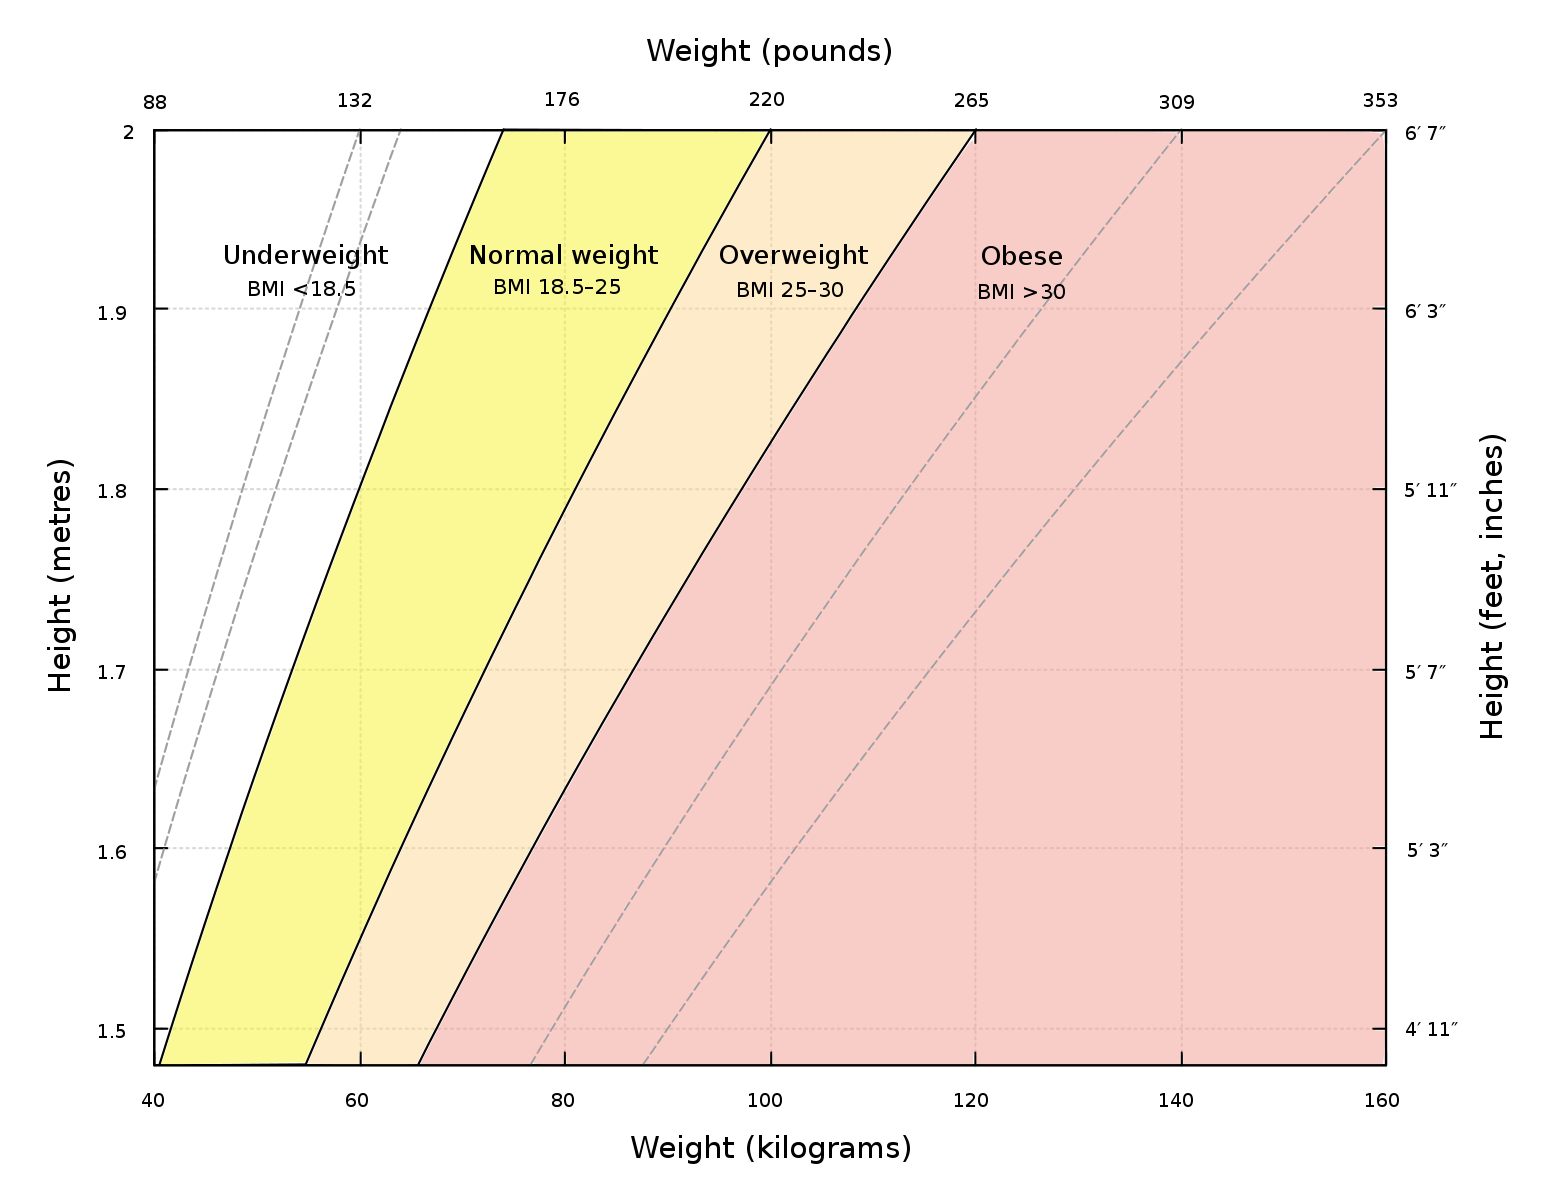
The BMI may be determined using a table or chart which displays BMI as a function of mass and height using contour lines or colours for different BMI categories, and which may use other units of measurement (converted to metric units for the calculation).

The BMI is a convenient rule of thumb used to broadly categorize a person as underweightnormal weightoverweight, or obese based on tissue mass (muscle, fat, and bone) and height. That categorization is the subject of some debate about where on the BMI scale the dividing lines between categories should be placed. Commonly accepted BMI ranges are underweight (under 18.5 kg/m2), normal weight (18.5 to 25), overweight (25 to 30), and obese (over 30).

A graph of body mass index as a function of body mass and body height. The dashed lines represent subdivisions within a major class.

BMIs under 20 and over 25 have been associated with higher all-causes mortality, with the risk increasing with distance from the 20–25 range.

Obesity and BMI


Children (aged 2 to 20)

BMI for age percentiles for boys 2 to 20 years of age.

BMI for age percentiles for girls 2 to 20 years of age.

BMI is used differently for children. It is calculated in the same way as for adults, but then compared to typical values for other children of the same age. Instead of comparison against fixed thresholds for underweight and overweight, the BMI is compared against the percentiles for children of the same sex and age.

A BMI that is less than the 5th percentile is considered underweight and above the 95th percentile is considered obese. Children with a BMI between the 85th and 95th percentile are considered to be overweight.

Recent studies in Britain have indicated that females between the ages 12 and 16 have a higher BMI than males of the same age by 1.0 kg/m2 on average.


Comments