BMI formula
The BMI (Body Mass Index) in (kg/m2) is equal to the mass in kilograms (kg) divided by the square height in meters (m):
BMI(kg/m2) = mass(kg) / height2(m)
The BMI (Body Mass Index) in (kg/m2) is equal to the mass in pounds (lbs) divided by the square height in inches (in) times 703:
BMI(kg/m2) = mass(lb) / height2(in) × 703
International variations
These recommended distinctions along the linear scale may vary from time to time and country to country, making global, longitudinal surveys problematic. People from different ethnic groups, populations, and descent have different associations between BMI, percentage of body fat, and health risks, with a higher risk of type 2 diabetes mellitus and atherosclerotic cardiovascular disease at BMIs lower than the WHO cut-off point for overweight, 25 kg/m2, although the cut-off for observed risk varies among different populations. The cut-off for observed risk varies based on populations and subpopulations both in Europe and Asia.
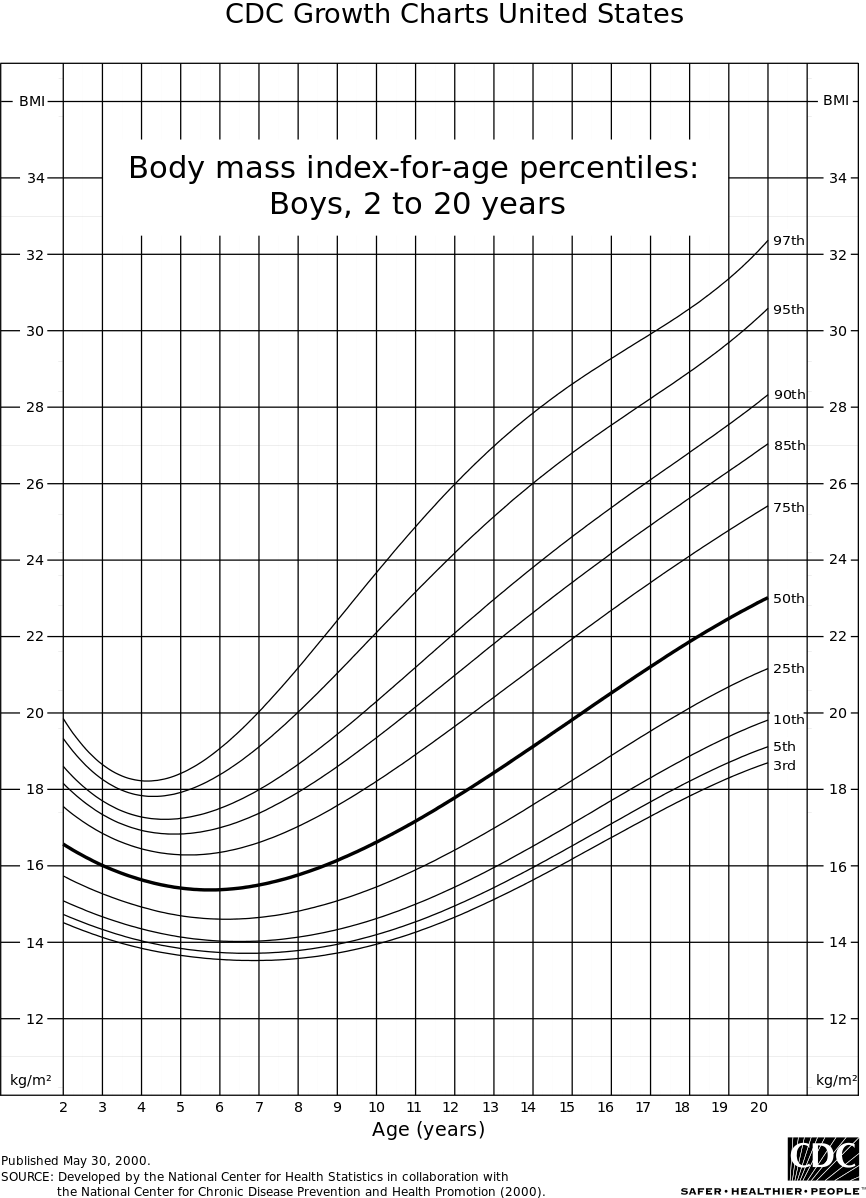
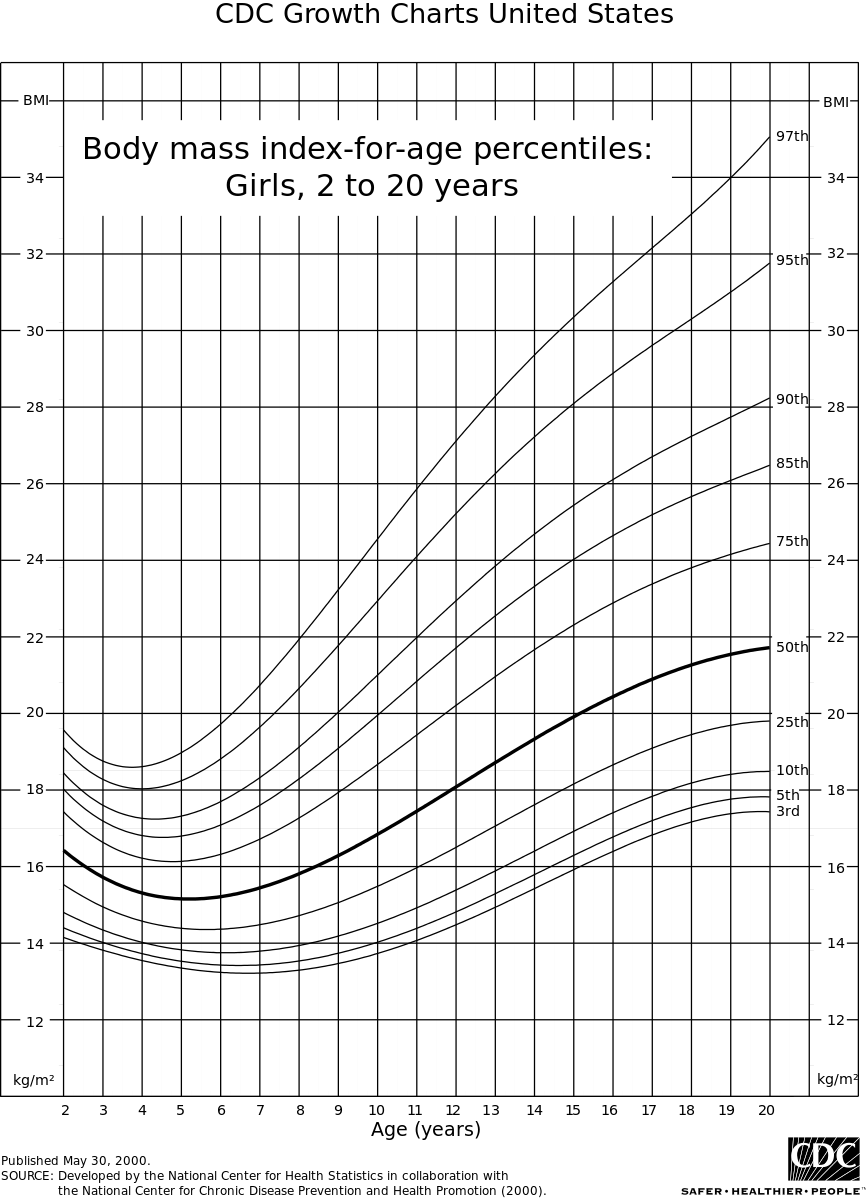
United States
In 1998, the U.S. National Institutes of Health and the Centers for Disease Control and Prevention brought U.S. definitions in line with World Health Organization guidelines, lowering the normal/overweight cut-off from BMI 27.8 to BMI 25. This had the effect of redefining approximately 29 million Americans, previously healthy, to overweight.
This can partially explain the increase in the overweight diagnosis in the past 20 years, and the increase in sales of weight loss products during the same time. WHO also recommends lowering the normal/overweight threshold for South East Asian body types to around BMI 23, and expects further revisions to emerge from clinical studies of different body types.
The U.S. National Health and Nutrition Examination Survey of 2015-2016 showed that 71.6% of American men and women had BMIs over 25. Obesity—a BMI of 30 or more—was found in 39.8% of the US adults. A survey in 2007 showed 63% of Americans are overweight or obese, with 26% in the obese category (a BMI of 30 or more). As of 2014, 37.7% of adults in the United States were obese, categorized as 35.0% of men and 40.4% of women; class 3 obesity (BMI over 40) values were 7.7% for men and 9.9% for women.
|
Body Mass Index values for males and females aged 20 and over, and selected percentiles by age: United States, 2011–2014.
|
|
|
Age
|
Percentile
|
|
|
5th
|
10th
|
15th
|
25th
|
50th
|
75th
|
85th
|
90th
|
95th
|
|
|
Men BMI (kg/m2)
|
|
|
20 years and over (total)
|
20.7
|
22.2
|
23.0
|
24.6
|
27.7
|
31.6
|
34.0
|
36.1
|
39.8
|
|
|
20–29 years
|
19.3
|
20.5
|
21.2
|
22.5
|
25.5
|
30.5
|
33.1
|
35.1
|
39.2
|
|
|
30–39 years
|
21.1
|
22.4
|
23.3
|
24.8
|
27.5
|
31.9
|
35.1
|
36.5
|
39.3
|
|
|
40–49 years
|
21.9
|
23.4
|
24.3
|
25.7
|
28.5
|
31.9
|
34.4
|
36.5
|
40.0
|
|
|
50–59 years
|
21.6
|
22.7
|
23.6
|
25.4
|
28.3
|
32.0
|
34.0
|
35.2
|
40.3
|
|
|
60–69 years
|
21.6
|
22.7
|
23.6
|
25.3
|
28.0
|
32.4
|
35.3
|
36.9
|
41.2
|
|
|
70–79 years
|
21.5
|
23.2
|
23.9
|
25.4
|
27.8
|
30.9
|
33.1
|
34.9
|
38.9
|
|
|
80 years and over
|
20.0
|
21.5
|
22.5
|
24.1
|
26.3
|
29.0
|
31.1
|
32.3
|
33.8
|
|
|
Age
|
Women BMI (kg/m2)
|
|
|
20 years and over (total)
|
19.6
|
21.0
|
22.0
|
23.6
|
27.7
|
33.2
|
36.5
|
39.3
|
43.3
|
|
|
20–29 years
|
18.6
|
19.8
|
20.7
|
21.9
|
25.6
|
31.8
|
36.0
|
38.9
|
42.0
|
|
|
30–39 years
|
19.8
|
21.1
|
22.0
|
23.3
|
27.6
|
33.1
|
36.6
|
40.0
|
44.7
|
|
|
40–49 years
|
20.0
|
21.5
|
22.5
|
23.7
|
28.1
|
33.4
|
37.0
|
39.6
|
44.5
|
|
|
50–59 years
|
19.9
|
21.5
|
22.2
|
24.5
|
28.6
|
34.4
|
38.3
|
40.7
|
45.2
|
|
|
60–69 years
|
20.0
|
21.7
|
23.0
|
24.5
|
28.9
|
33.4
|
36.1
|
38.7
|
41.8
|
|
|
70–79 years
|
20.5
|
22.1
|
22.9
|
24.6
|
28.3
|
33.4
|
36.5
|
39.1
|
42.9
|
|
|
80 years and over
|
19.3
|
20.4
|
21.3
|
23.3
|
26.1
|
29.7
|
30.9
|
32.8
|
35.2
|
|